Hello everyone and welcome to the new look WPM. Included below are the charts for Burglary Residential, Burglary Non-Residential and Theft of and From Motor Vehicle. I have given a brief synopsis under each chart.
Due to the exceptional circumstances of the ongoing global pandemic, I will take the opportunity to compare the last three months of lockdown to the same three months of 2019.
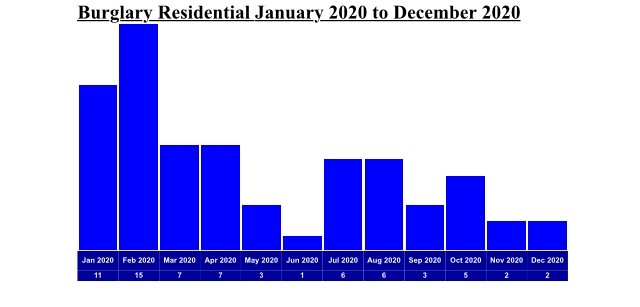
There were 68 residential burglaries in the 12 months from January 2020. This is compared to 136 in the previous period, an exact 50% decrease. In the last 3 months we have had 9 offences compared which is a 75% decrease to the 36 residential burglaries same time in 2019. As discussed in the last meeting, this noticeable drop seems to be mainly COVID-19 related. There are a lot more people at home and working from home, which reduced the opportunity for the criminals
Local Police team have also been conducting patrols around the hotspots and most active areas for burglars when we can. This along with the help of smart water would be another factor for the noticeable decrease in the offence.
However, it would be naive to state that the job is done. The criminals are still out there and we will continue to carry out our patrols and visible patrols to detour and disrupt the criminals.
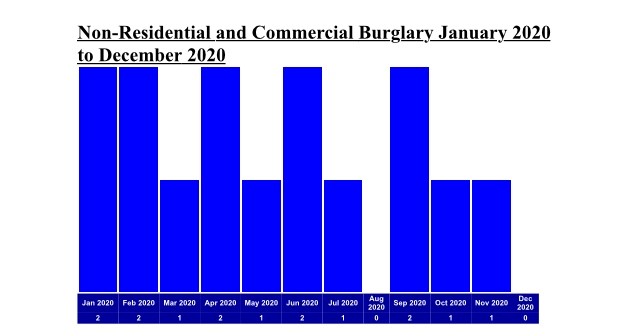
There were 15 offences in the 12 months from January 2020. There were 64 in the previous month period, this is 76.5% decrease. During the COVID19 months there were 2 offences compared to 11 in the previous period.
Again, these are impressive figures and the lockdown meant that many shop owners are reducing stocks. Couple that with a massive reduction of vehicle traffic and it made that period very difficult for any would be burglars to travel and prevented possible thefts.
With increase number of daily exercisers and walkers along with the network of CCTV cameras in place on Royal Parade will also act a big deterrent and hinder any opportunity for criminals.
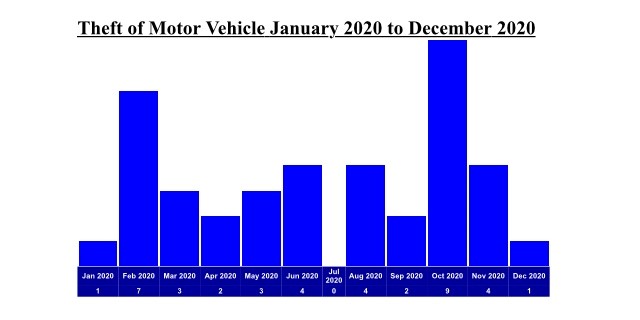
There were 40 offences in the year from January 2020. This is in comparison to the previous period where there were 50 which is a 20% decrease. Even though these is decrease, thefts of high value cars have been increasing across the country lately. This is due to the use of keyless entry and start technology.
The fault with keyless entry and start has been an issue for us as Police. We know what’s the cause and how is committed, however we are unable to prevent it from happening with the technology we have.
We stressed the importance of Faraday pouches number of times in the past meetings. As advised on previous WPM, Use of a Faraday Bag and moving the keys a good distance from the front door will reduce the risks dramatically. Also, in a weird twist, protecting your high value technological marvel of a car is now best achieved with the use of an olde-worlde steering wheel lock. It would appear that the time spent and noise created in removing these locks is usually enough to deter would be thieves.
There are many variants when it comes to steering locks but it is an idea to invest in a decent one. A £100-£150 investment is well worth it if it stops your car being stolen (point three of a percent of the cost of the average car stolen).
Please make residence aware of such issues and solutions in regards to car thefts. This is the information we provide to all our victims of this particular crime.
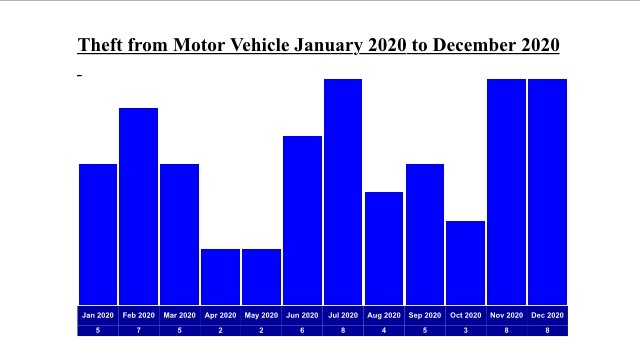
There were 63 offences for the year period from January 2020. This is in comparison to 125 in the same period a year ago. That is a nearly 49.5% decrease. It is highly likely that COVID19 again was one of the reasons.
In in the last 3 months there were 19 offences as opposed to 32 in the same period in 2019. With theft from M/V it includes builders and delivery vans temporarily on the ward. Some of the reasons for the number of thefts were still as they always have been though… valuables left on display in the car and/or cars left unlocked which prove too tempting for opportunistic thieves. We have been patrolling and when possible leaving police leaflets on windows advising them of the possible risks of leaving goods on display.
Another reason for these numbers are catalyst converters thefts. These are commonly stolen from hybrid cars for the precious metal stored within in them to control and produce a less toxic pollutant.
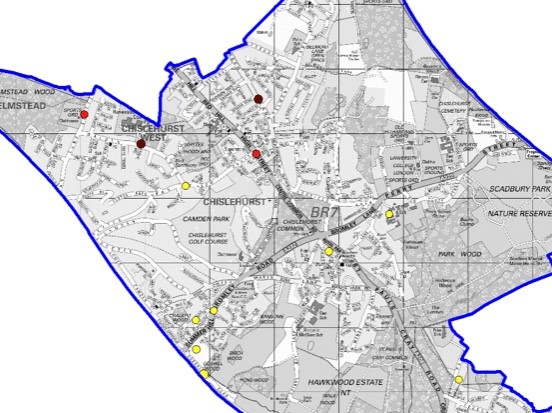
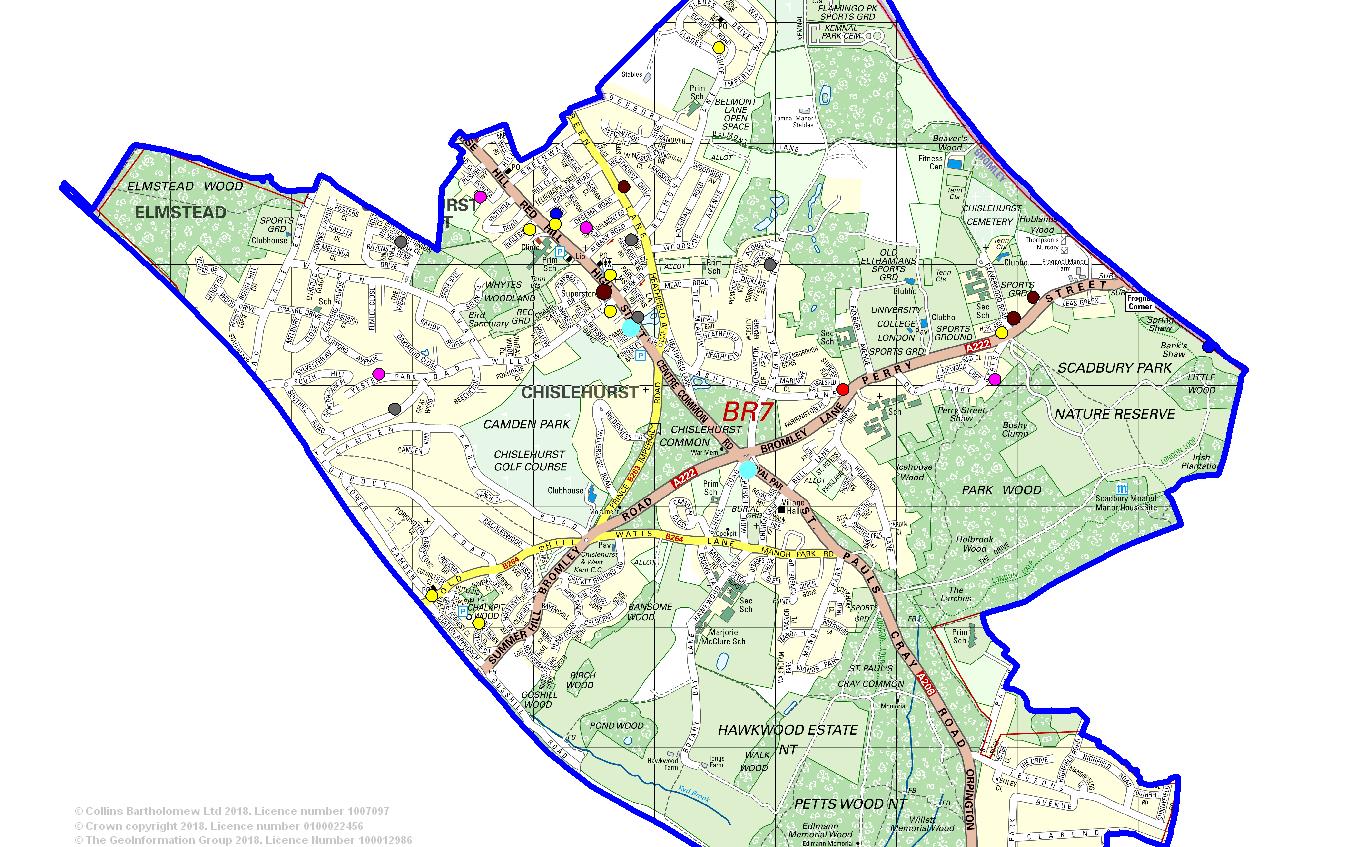
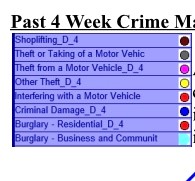
Past 4 Week Crime Map
Above is a map containing 4 weeks of crime mapping. This gives an indication as to where most the crime in our wards are taking place. As we can see most the crime are taking place on the high streets and main roads. This due to the nature of high street and how populated and its valuable business, which attracts criminals. It is also due to the ease of exit should they encounter and disturbances in their activity. This data could provide an upper hand with the council to argue our case to increase the CCTV coverage within Chislehurst.
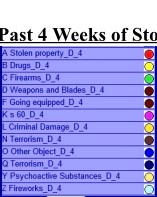
Past 4 Weeks of Stop and Search
This map indicated where they have been stop and searches in our ward. Stop and search is a big issue within the Met. It is encouraged that we put hands in people’s pockets where possible to make sure our streets are safe from weapons, drugs and other items and articles in concern that could disrupt the peace within our community. The areas where stop search is near to hotspots of where we have youths congregating, LPT regularly patrol these areas for any troublemakers.